Simulated Racer: Loudenvielle
The dust has settled on the Loudenvielle World Cup downhill, and while Jackson Goldstone definitively proved he's back at the top, a deeper dive into the numbers reveals a fascinating story of raw speed, untapped potential, and what could have been.
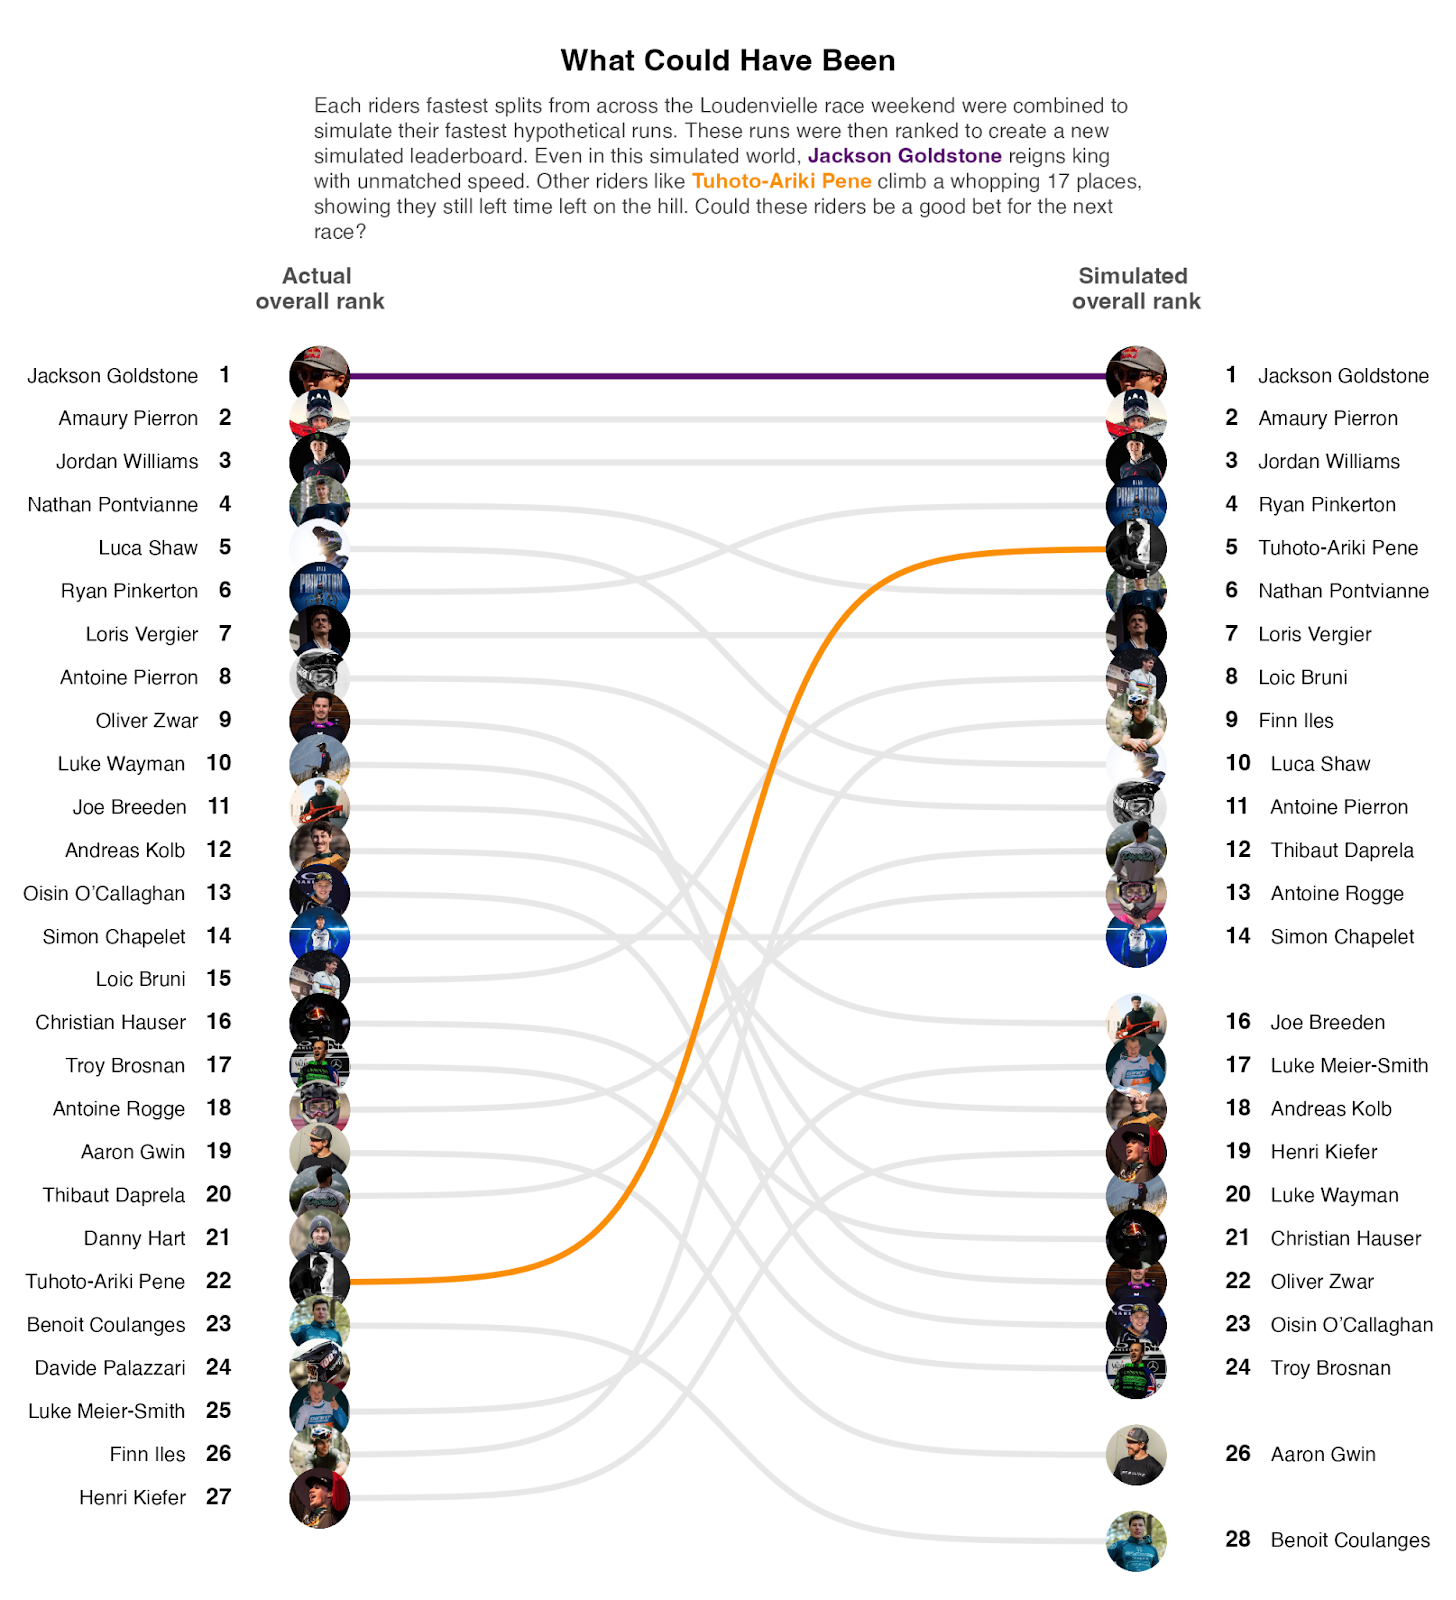
Goldstone’s victory was clear: he pieced together the fastest section times, on average, to secure the win. But what about the riders who showed flashes of brilliance but couldn't quite put it all together when it mattered most? Could these riders be a dark horse for the next race?
To answer this, we can simulate each rider's "perfect run" based on their fastest split times across the entire race weekend in Loudenvielle. The course was broken into five timed sections, and riders' times were recorded up to eight times throughout the event – from timed training runs to qualifying rounds and finals. This wealth of data allows us to cherry-pick each rider’s fastest segment from any of their runs and combine them for a theoretical best.
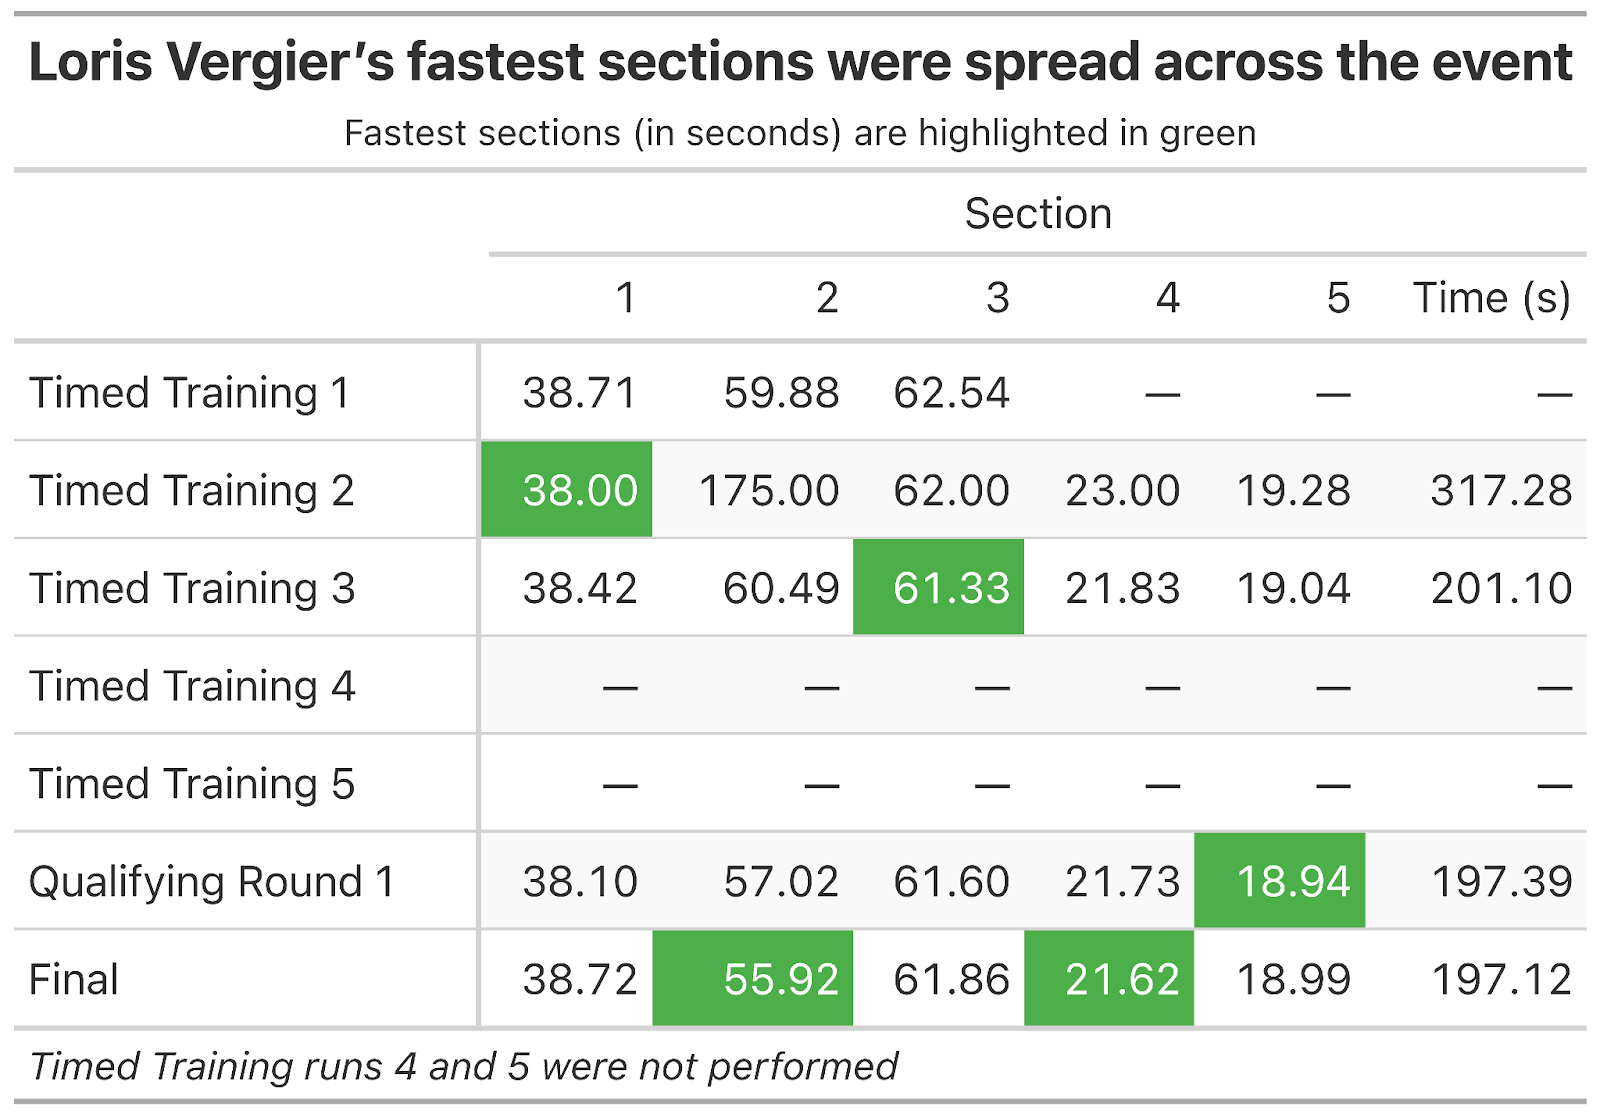
Take Loris Vergier, for example. His fastest actual run in the finals was 197.12s (3:17.12). However, by piecing together his fastest segments from various runs throughout the weekend, his simulated "perfect run" clocks in at 195.8s (3:15.8) – a full 1.3 seconds faster! In a sport often decided by milliseconds, that's an eternity. Where would that have placed him? How would it have shaken up the overall standings?
The Time Left on the Track
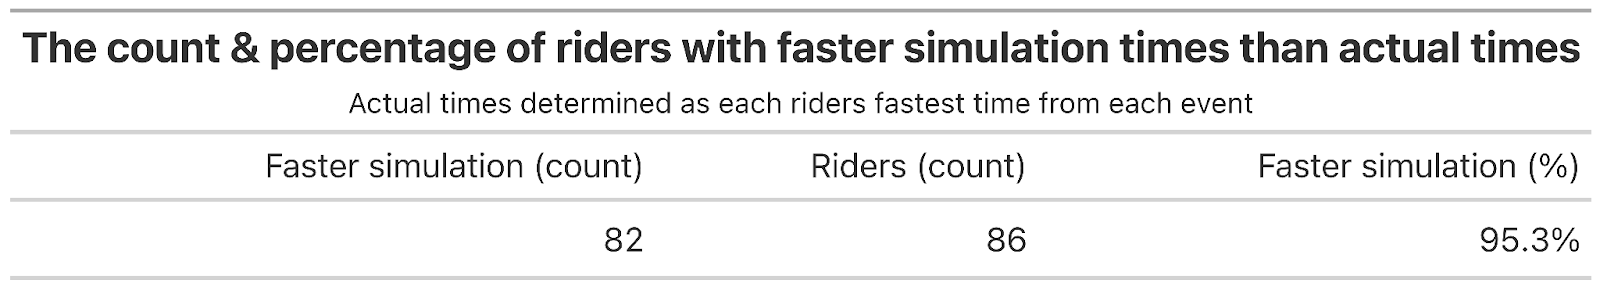
Loris wasn't alone in leaving some seconds out on the course. A surprising 95.3% of elite male riders (82 out of 86) had a faster theoretical best run than their actual fastest race run.
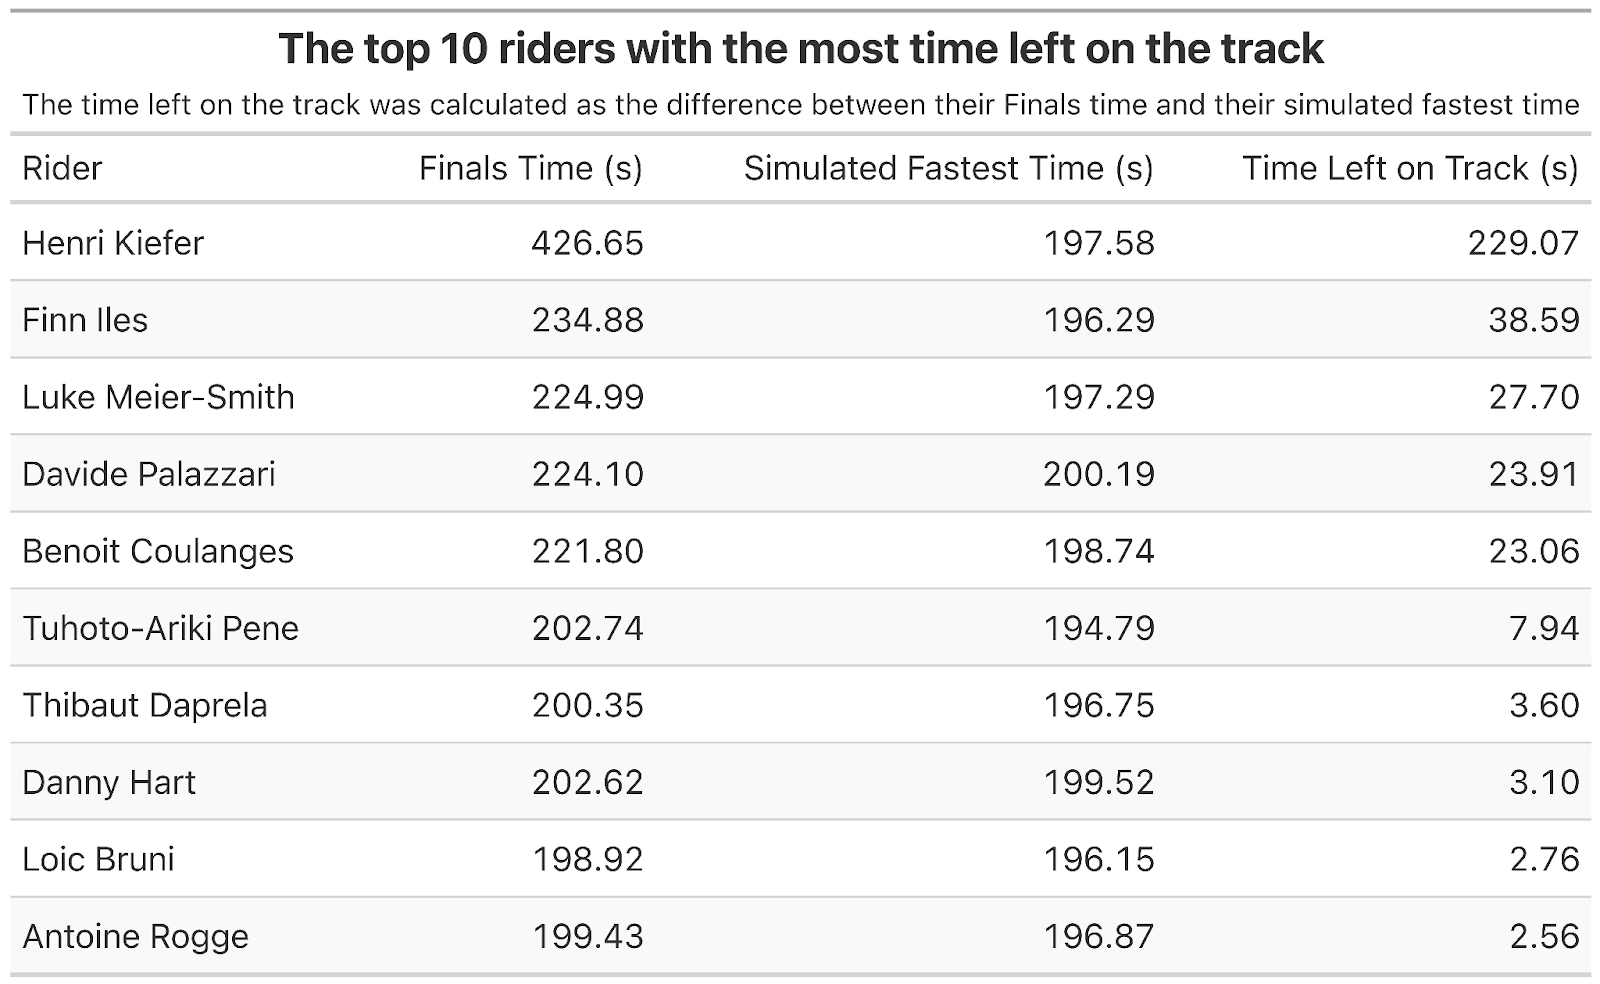
Diving deeper into the data we can also visualise which riders left the most time on the track. While the top few riders are unsurprising given crashes during their Finals runs, it is unusual to see the likes of Loic Bruni in this list, last year's overall winner. It just wasn’t his day in Loudenvielle.
The Simulated Showdown
So, if everyone had laid down their absolute fastest possible run, how might the Loudenvielle race have unfolded?
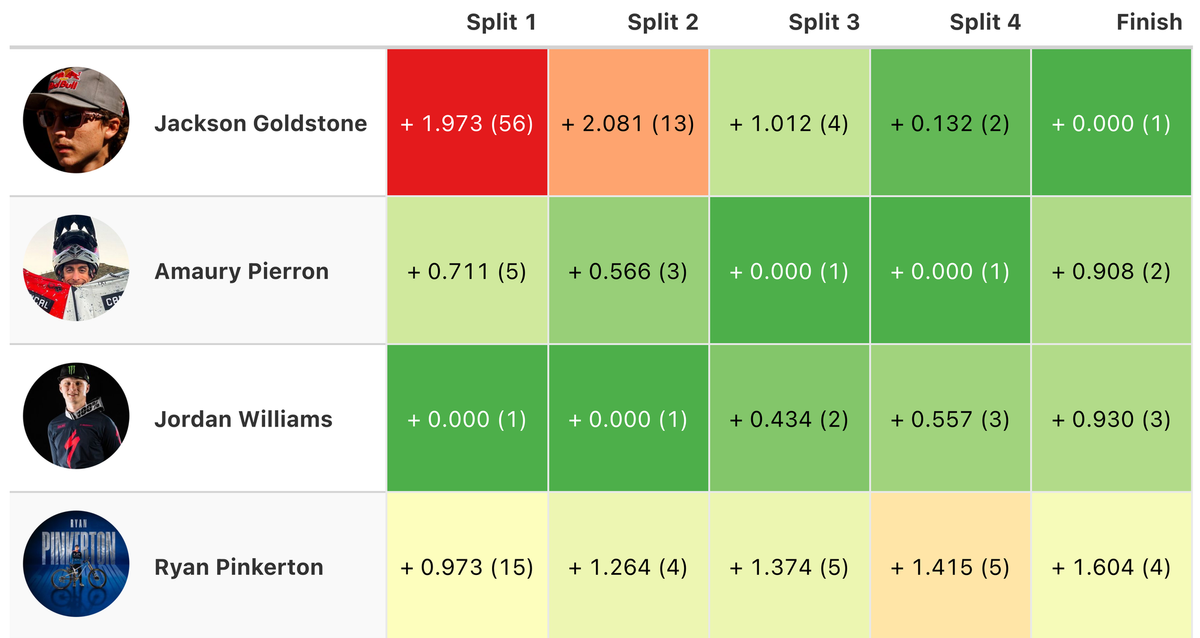
We can break down the top 10 simulated race winners by split times to recreate what the simulated race would have looked like:
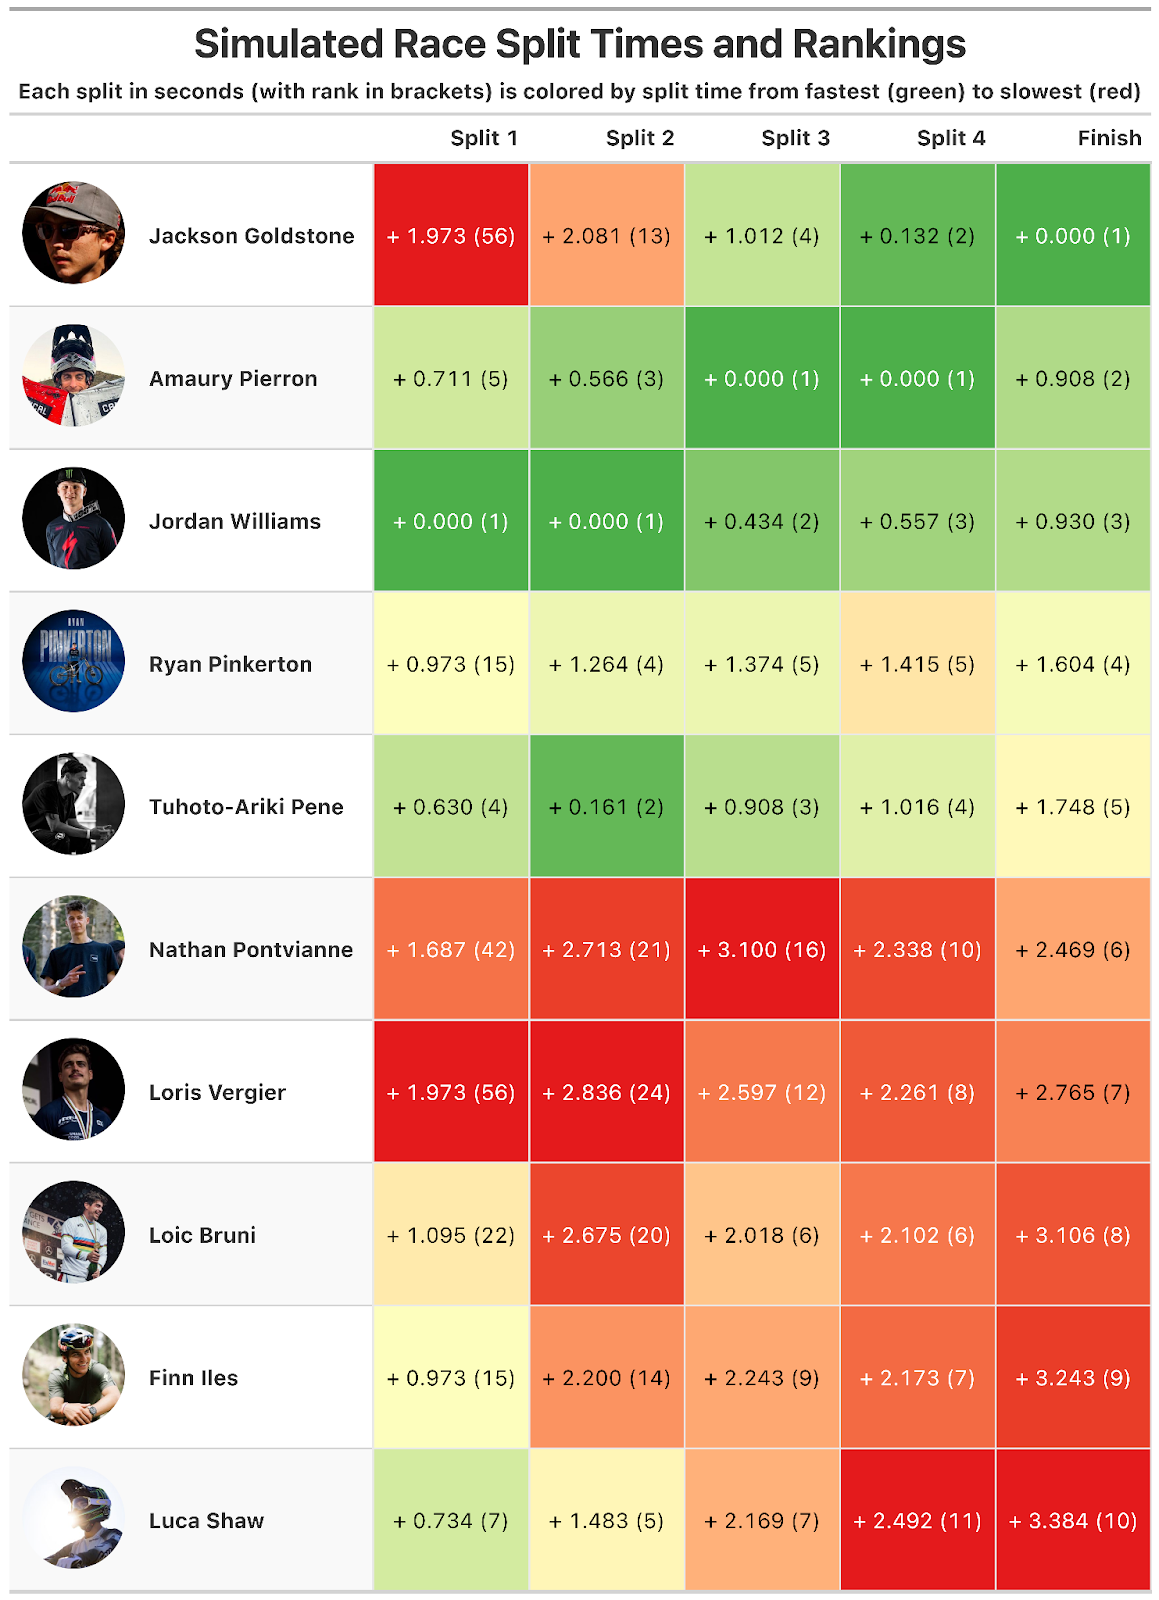
Post-race, Jackson mentioned feeling a disadvantage in the top section due to his lighter weight hindering his ability to carry speed. The simulated results back up this assertion, demonstrating that at no point across the weekend was Jackson able to put a strong split time down here. But he more than made up for it with his speed in the steeper low wood sections - a feat Loris Vergier, who also appeared to struggle with the top section, couldn't quite replicate this time around.
There was also speculation that Amaury Pierron's shot at the win was thwarted by fatigue, leaving him with nothing left in the tank for the bottom of the track. The simulated results suggest that even with a perfect run, his fastest bottom splits likely wouldn't have been enough to close the gap to Jackson.
And then there's Nathan Pontvianne. His fourth-place finish in the finals was no fluke. Even in the simulated race, he would have had a stellar ride, finishing sixth. He was absolutely on fire all weekend, even throwing a mid-run whip on the step-down reminiscent of Danny Hart’s infamous 2011 World Champs winning run in Champery. A true joy to watch!
The Ultimate Rider
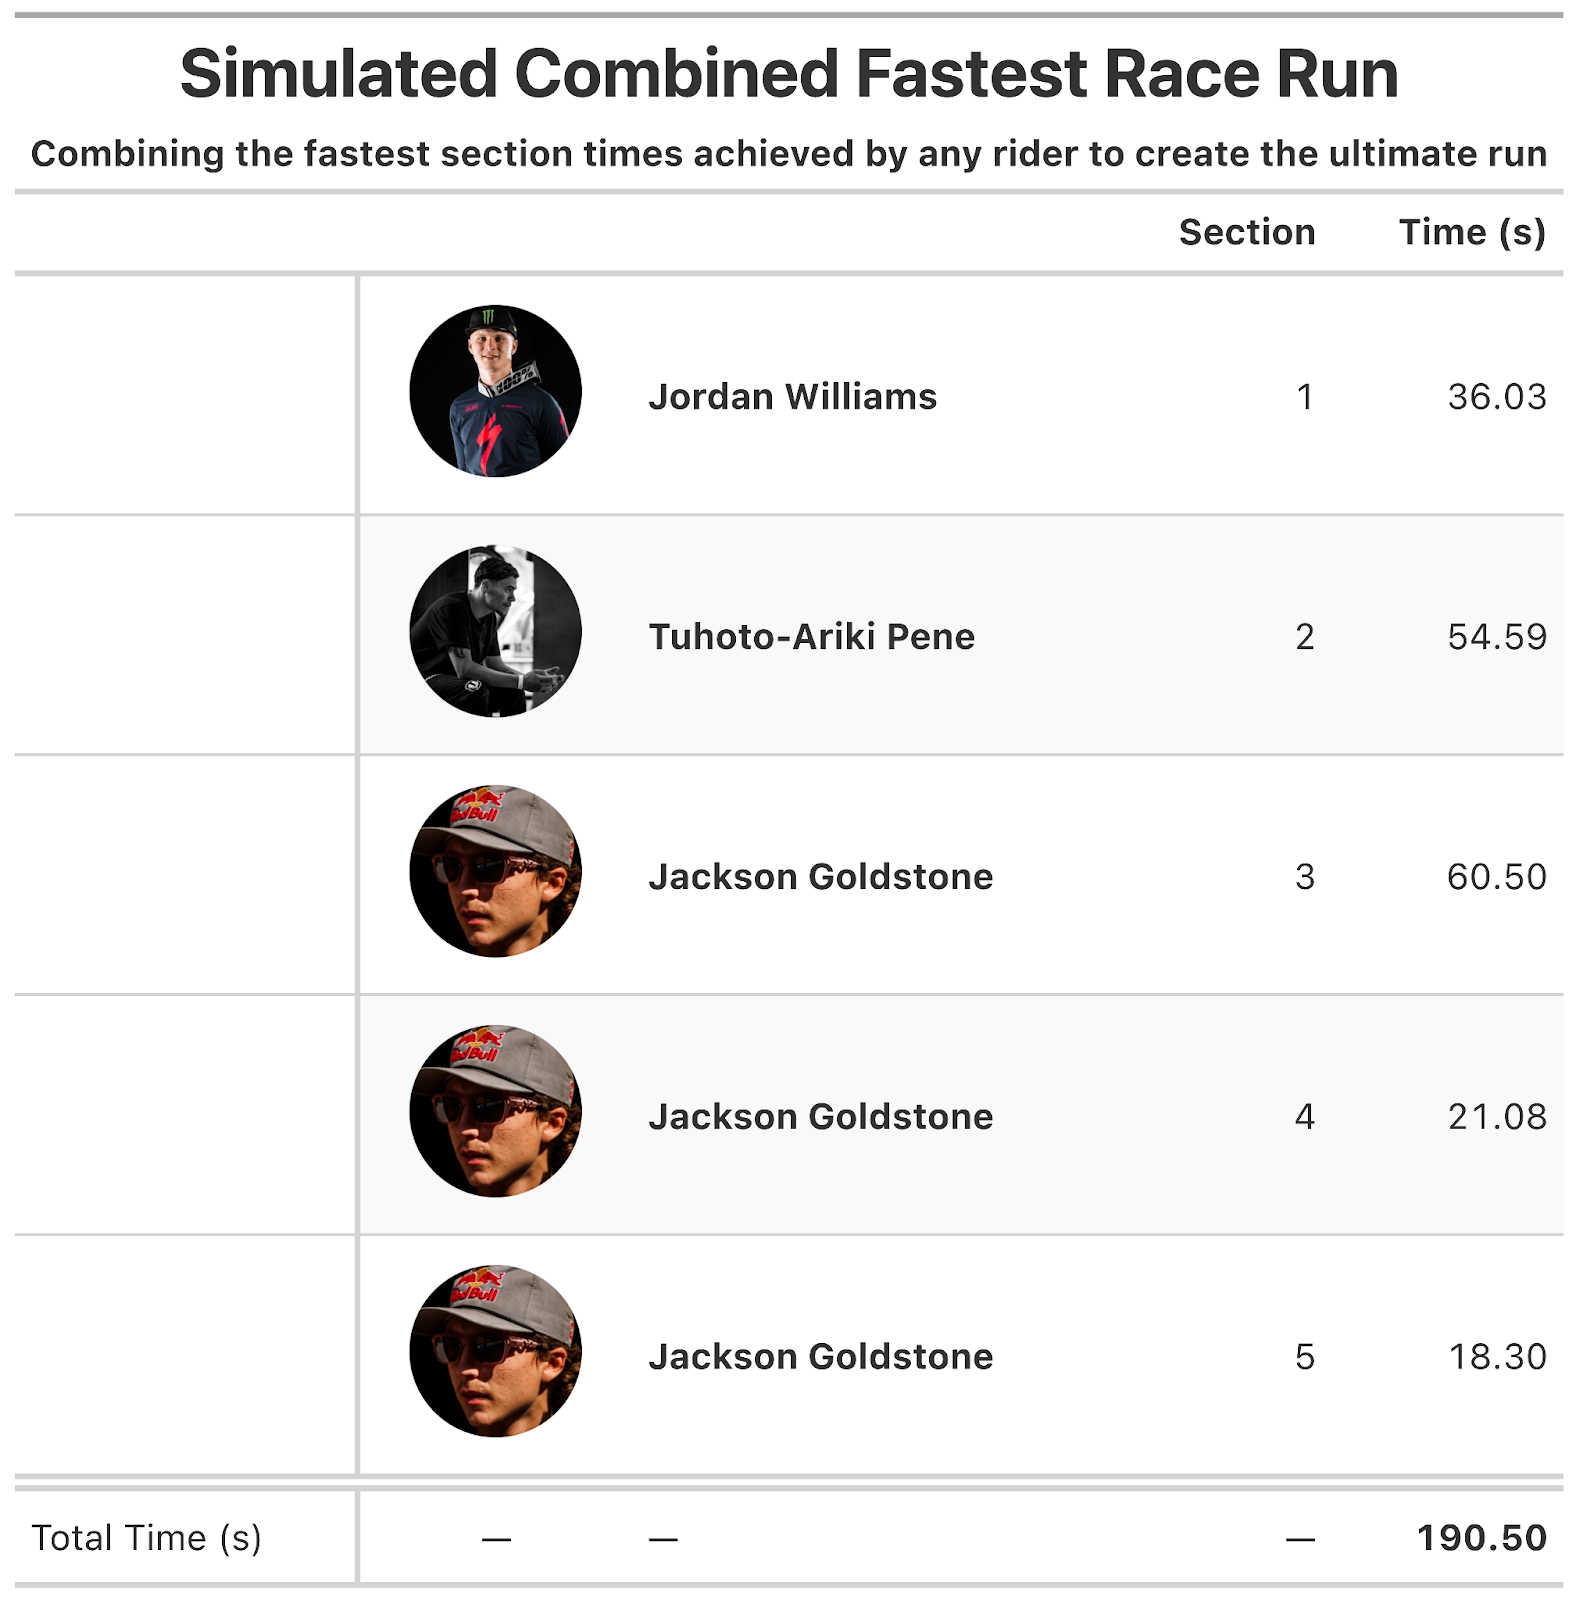
Beyond individual simulations, we can also imagine the "ultimate downhill rider" by combining the fastest split times from all riders. For each section, we take the fastest time achieved by anyone and piece them together.
This ultimate simulated run clocks in at 190.50s (3:10.50), nearly three seconds faster than Jackson Goldstone’s winning time of 193.19s (3:13.10). This highlights just how much potential speed was still out there on the Loudenvielle track, distributed among the various elite riders.
The Real Story: Section Three Was Key
While our simulated analysis provides a fascinating glimpse into what could have been, it's also important to examine how the race actually unfolded. By analyzing the time each rider lost to the leader in each section during the finals, we can see where the race was truly won and lost.
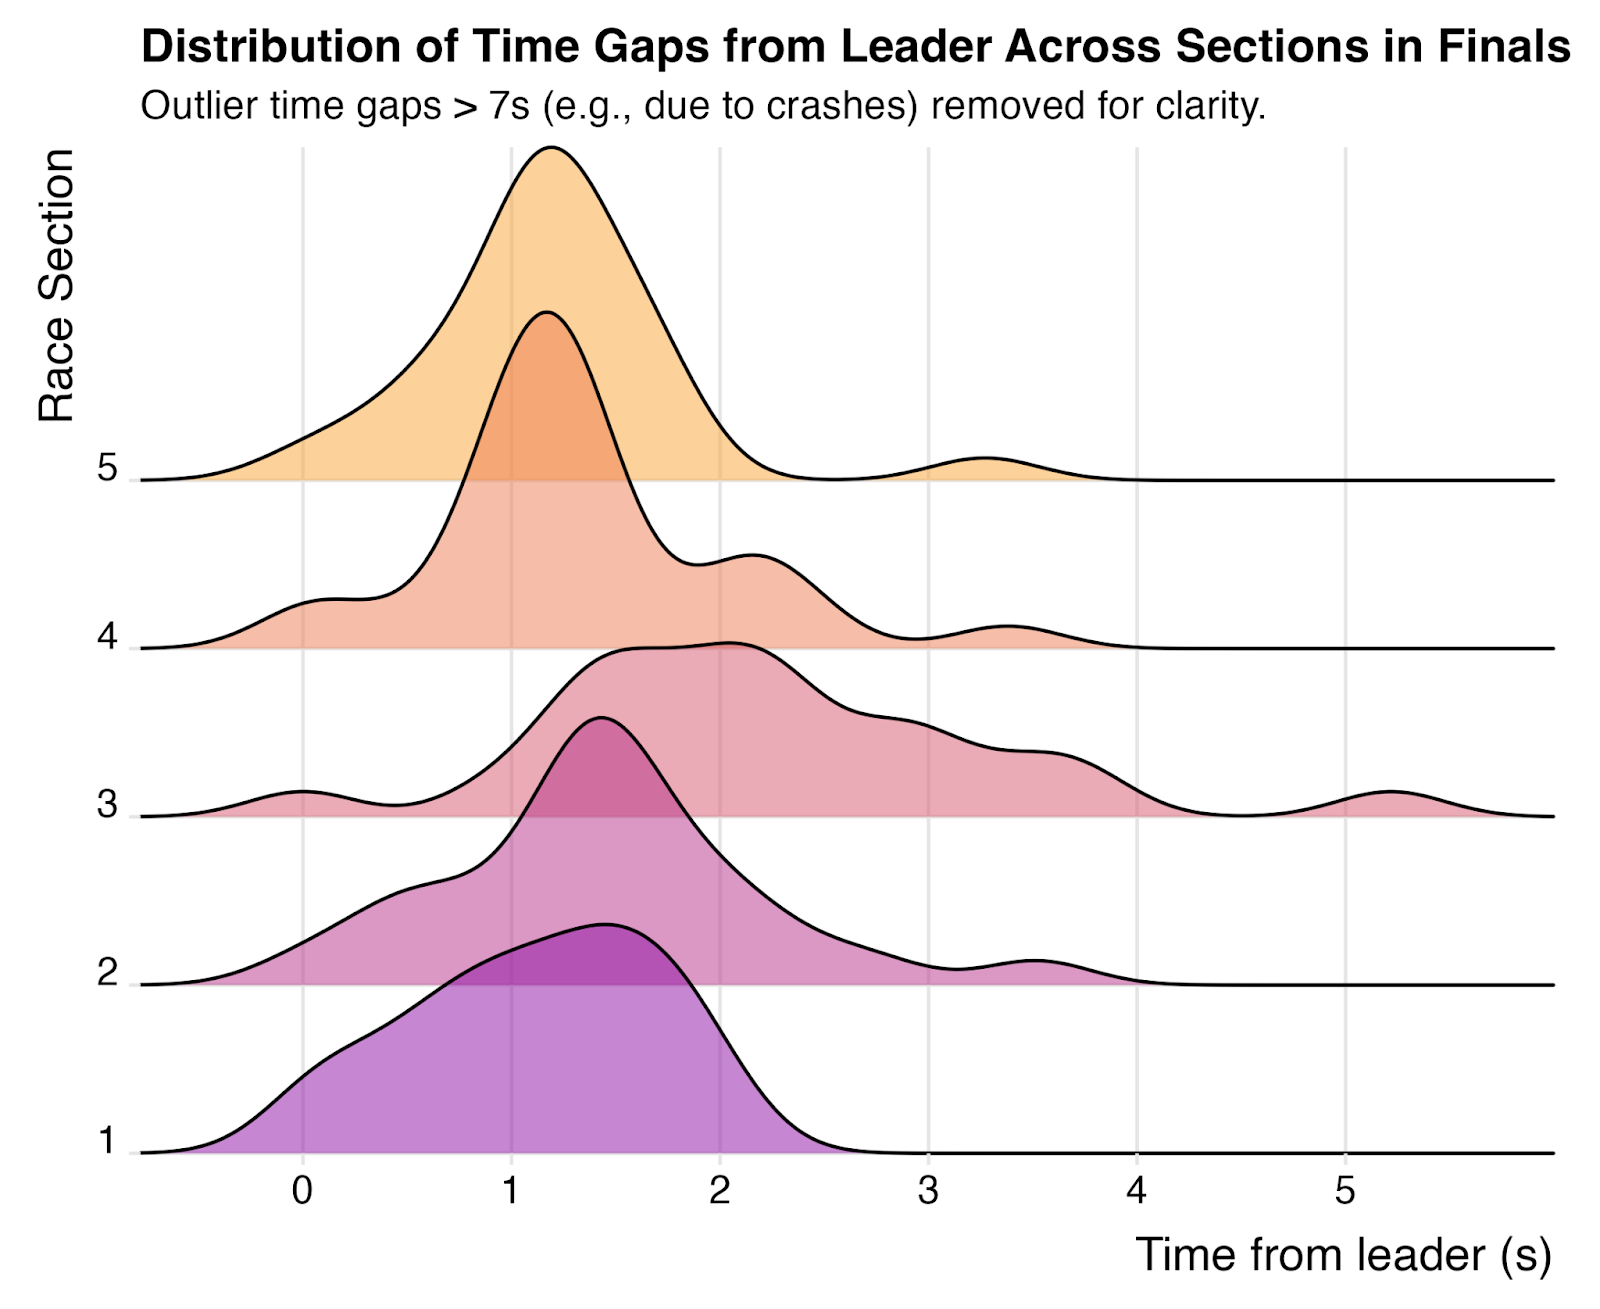
Section three stands out as the most pivotal part of the race. Not only did it show the widest variation in gap times, but the initial, distinct bump on the left of the distribution belongs to Jackson Goldstone. He gapped Amaury Pierron, the second-fastest rider in that section, by a massive 0.905s . The next biggest gap in any section was only 0.32s , in section two, between Tuhoto-Ariki Pene and Amaury Pierron. Jackson's winning margin in section three was almost three times that of any other rider in any other section. It's safe to say: he’s back.
Looking Ahead to Leogang
Leogang is just around the corner, and if you’re looking to make some savvy picks for your Vital Fantasy League, here are a few angles to consider:
- Raw Speed Unleashed: The simulated analysis, along with some of the actual results from Loudenvielle, hints at incredible raw speed from riders like Ryan Pinkerton, Tuhoto-Ariki Pene, and Nathan Pontvianne. It feels like only a matter of time before one of these talents masters their race craft and pieces together a winning run.
- Leogang's Hidden Potential: Looking back at last year's Leogang results through the lens of simulated fastest runs, both Troy Brosnan and Luca Shaw could have landed on the podium in second and third, respectively, despite actually finishing ninth and seventh. Interestingly, Loic Bruni was the undisputed king of Leogang last year, winning both the actual and simulated races.
- French Fury: Until last weekend, the French riders had been incredibly dominant on home soil. You can bet that Bruni, Vergier, and Pierron were disappointed to miss out on the gold medal in Loudenvielle and will likely come out firing on all cylinders in Leogang.
All the data and code used in this analysis can be found in the open-source downhillr R package here.