Simulated Racer: Leogang
Welcome back to Simulated Racer, the series where we dig into the World Cup race data to uncover what could have been. In our last installment, we dissected the Elite Men's field. This week, we're shifting gears to the Elite Women, and with Gracey Hemstreet taking her second consecutive win of the season, the question is: how did she do it? Was it pure consistency, or did she simply lay it all on the line? And more importantly, did anyone else have more potential just waiting to be unleashed?
Just like before, we’re simulating each rider’s "perfect run" by cherry-picking their fastest split times from any run across the entire Leogang race weekend. The track was broken into five timed sections, and with up to eight recorded runs per rider (from timed training to qualifying and finals), we've got a solid bank of data to pull from. This allows us to combine those fastest segments for a theoretical best-case scenario.
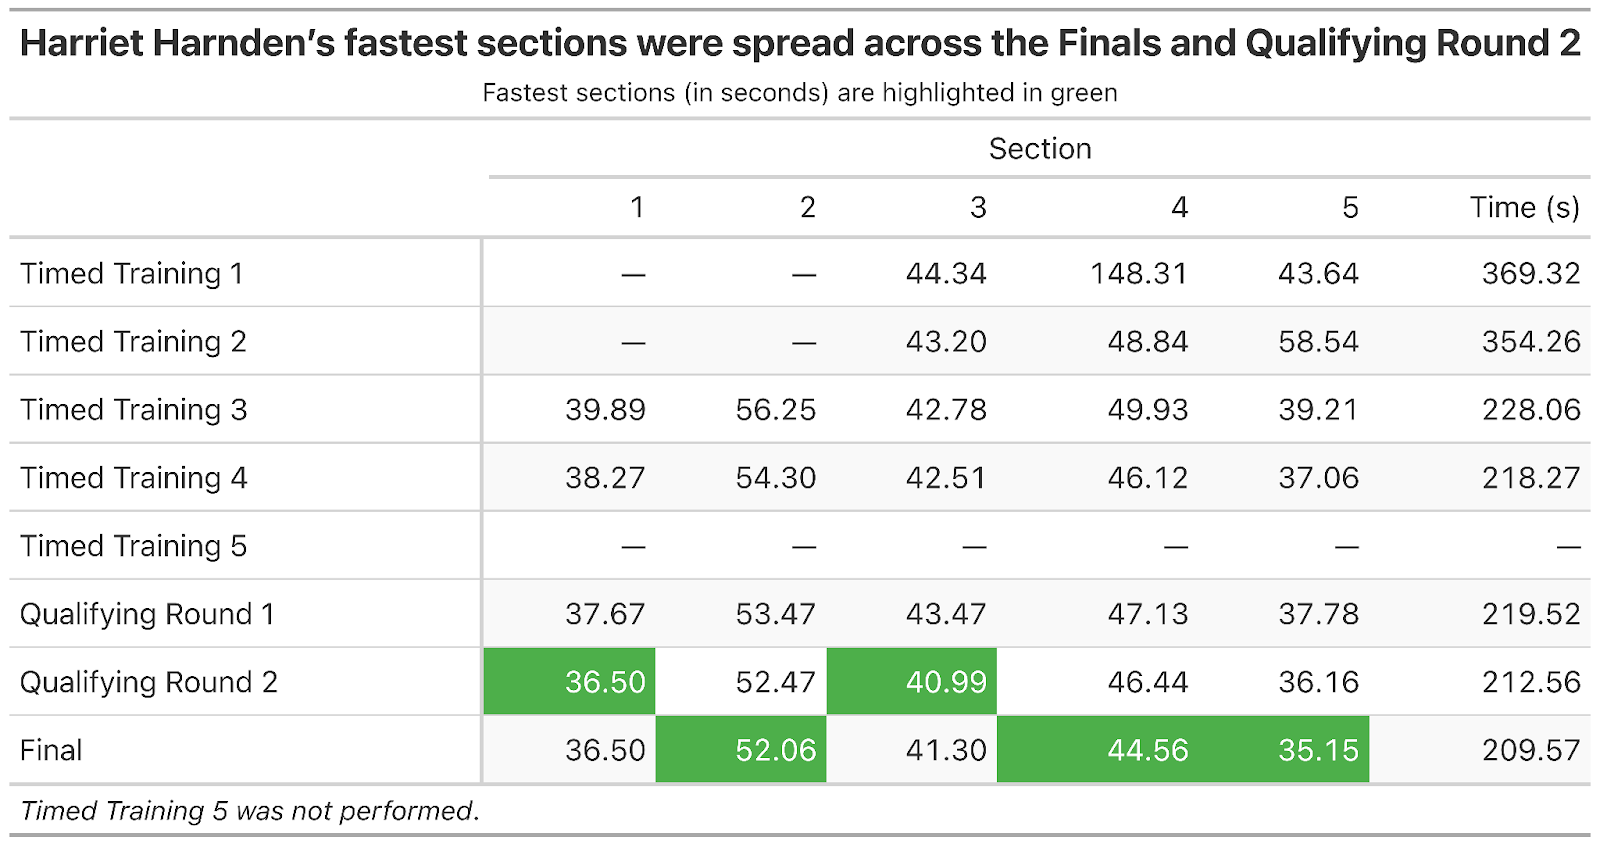
Take Harriet Harnden, for example. Her fastest actual run in the finals was 209.57s (3:29.57). But by piecing together her fastest segments from various runs throughout the weekend, split between Finals and Qualifying Round 2, her simulated "perfect run" clocks in at 209.26s (3:29.26) – a 0.3 second improvement. In a sport often decided by milliseconds, where would that have placed her? How would it have shuffled the overall standings?
The Time Left on the Track
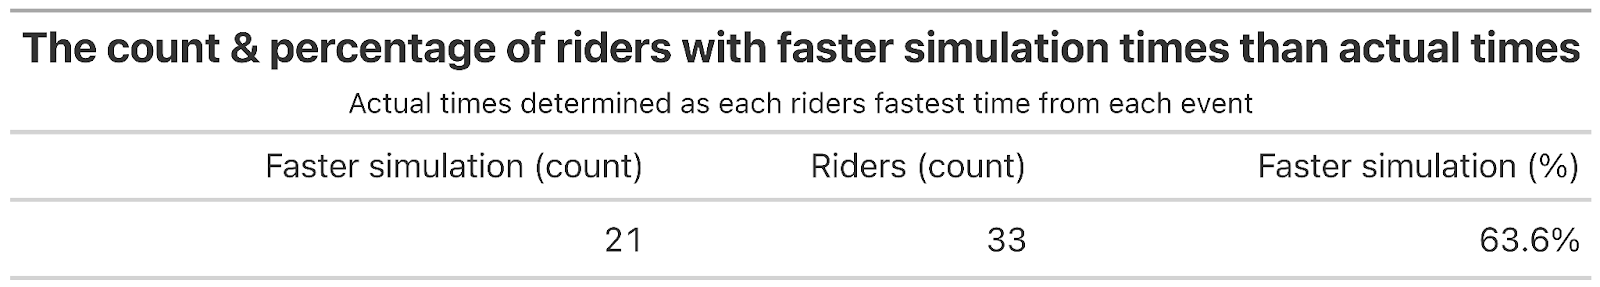
Hattie wasn't alone in leaving some seconds out on the course. 63.6% of Elite Female riders (21 out of 33) had a faster theoretical best run than their actual fastest run of the weekend.
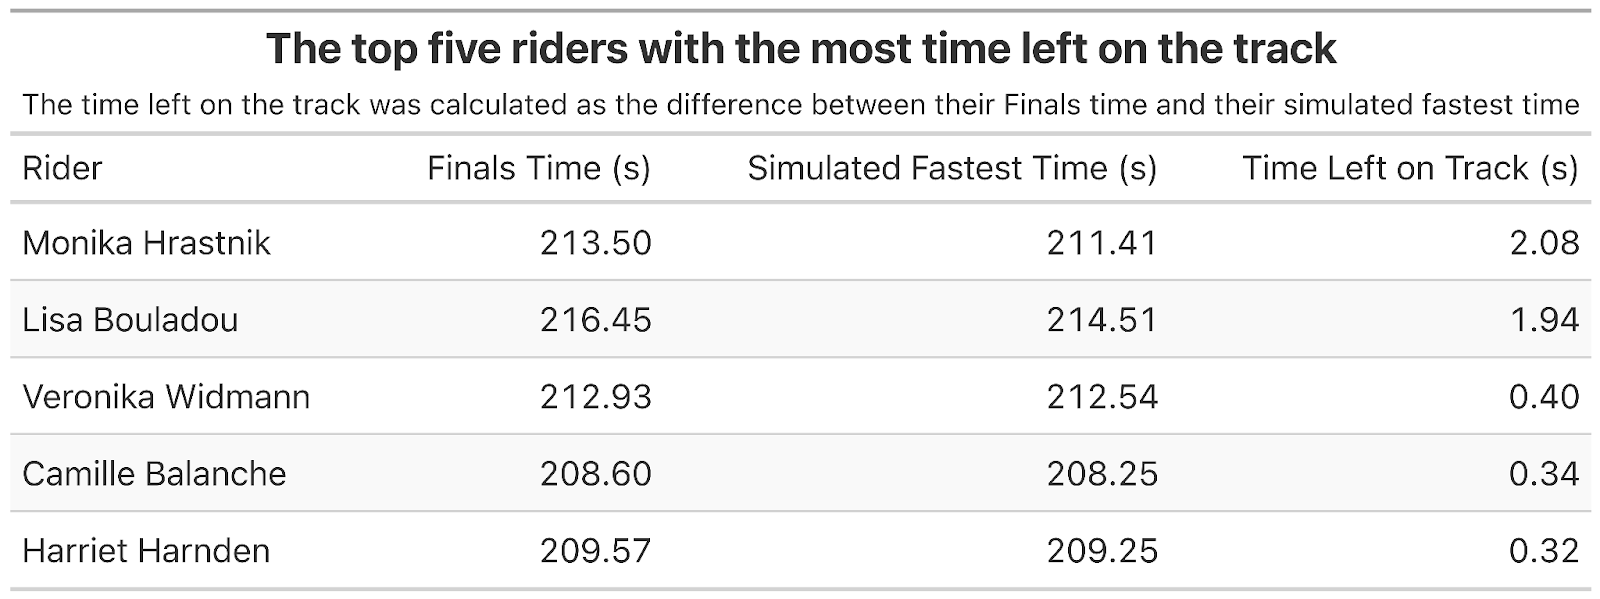
Diving deeper into the data we can also visualise which riders left the most time on the track. Interestingly, very few Elite Women were leaving much time out there, with only Monika Hrastnik and Lisa Bouladou leaving over a second on the hill.
The Simulated Showdown
As we're about to see, the minimal time left on the hill by most Elite Women creates a perhaps unsurprising narrative: their best times during Finals were, for the most part, the fastest they were capable of laying down. These results strongly suggest that throughout the race weekend, the Elite Females were progressively building their speed, ultimately delivering their fastest performance when it counted most.
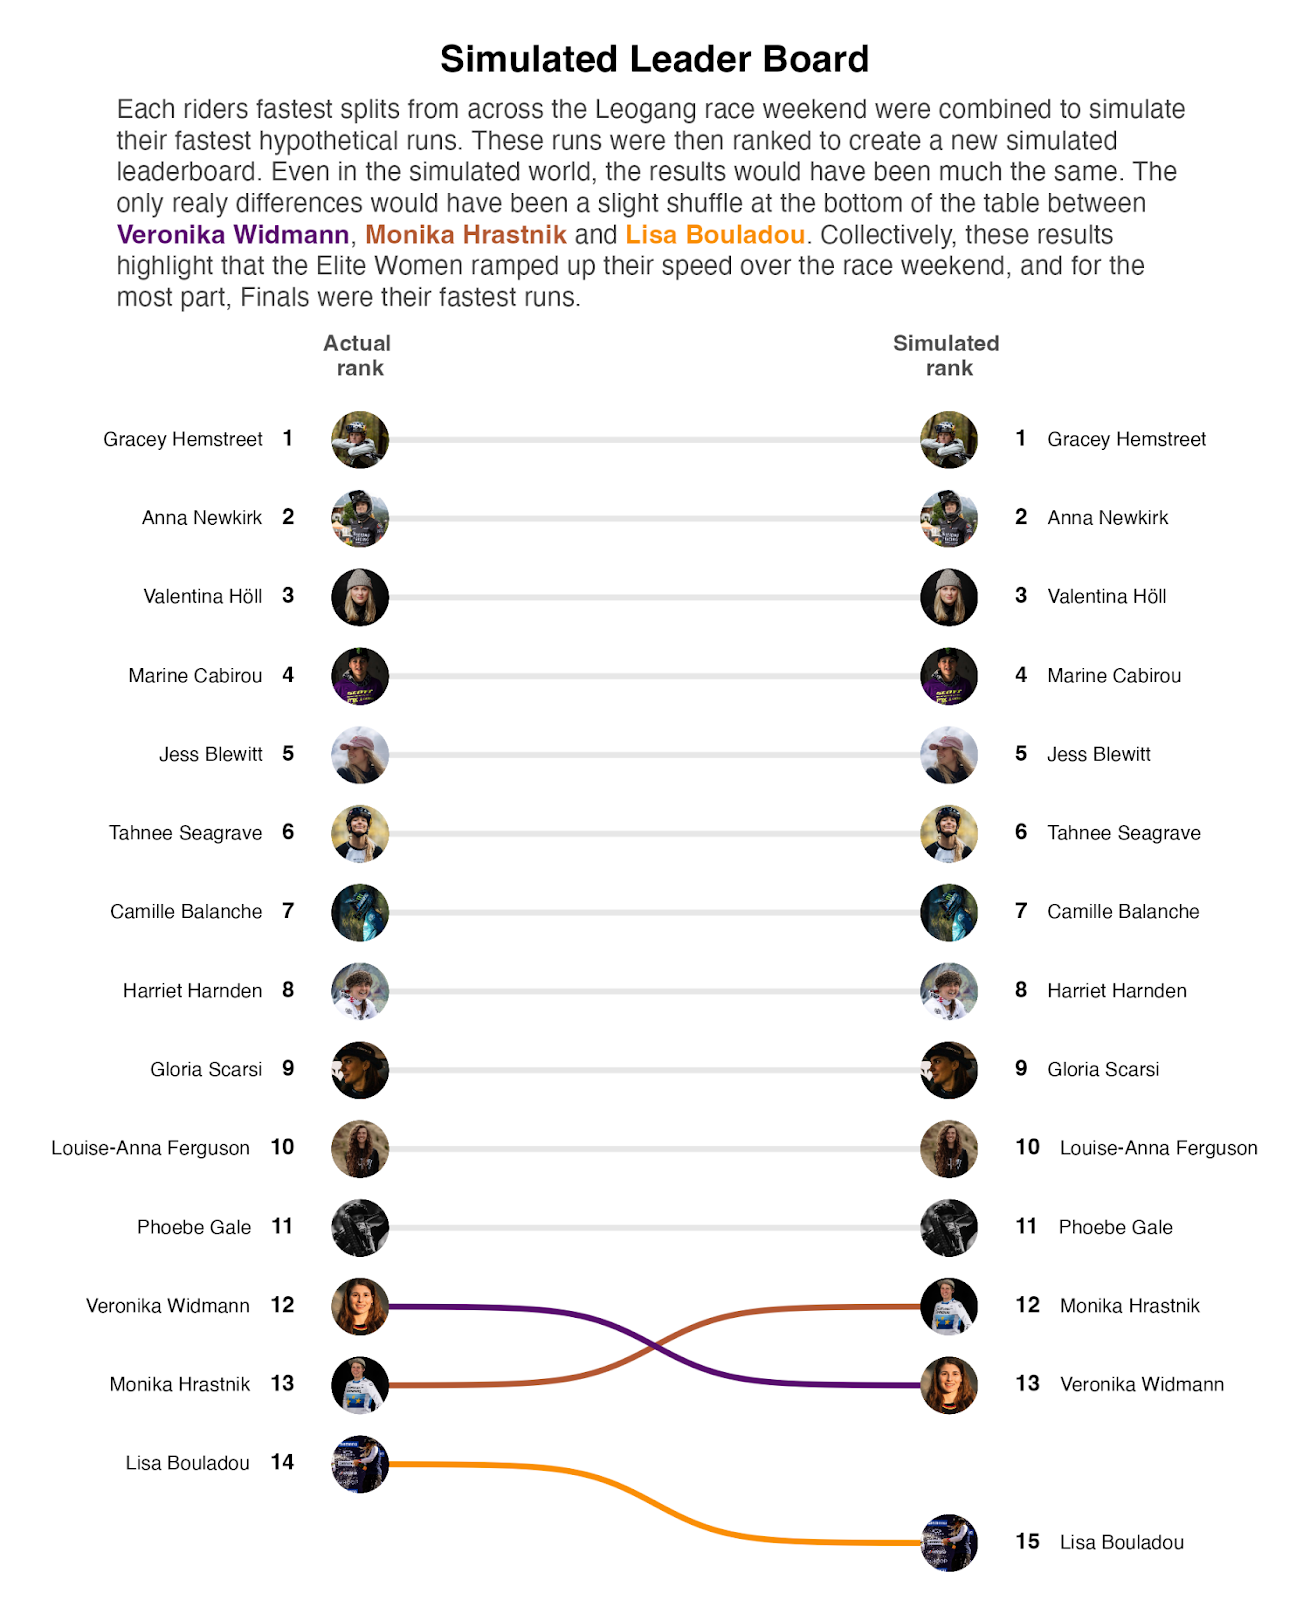
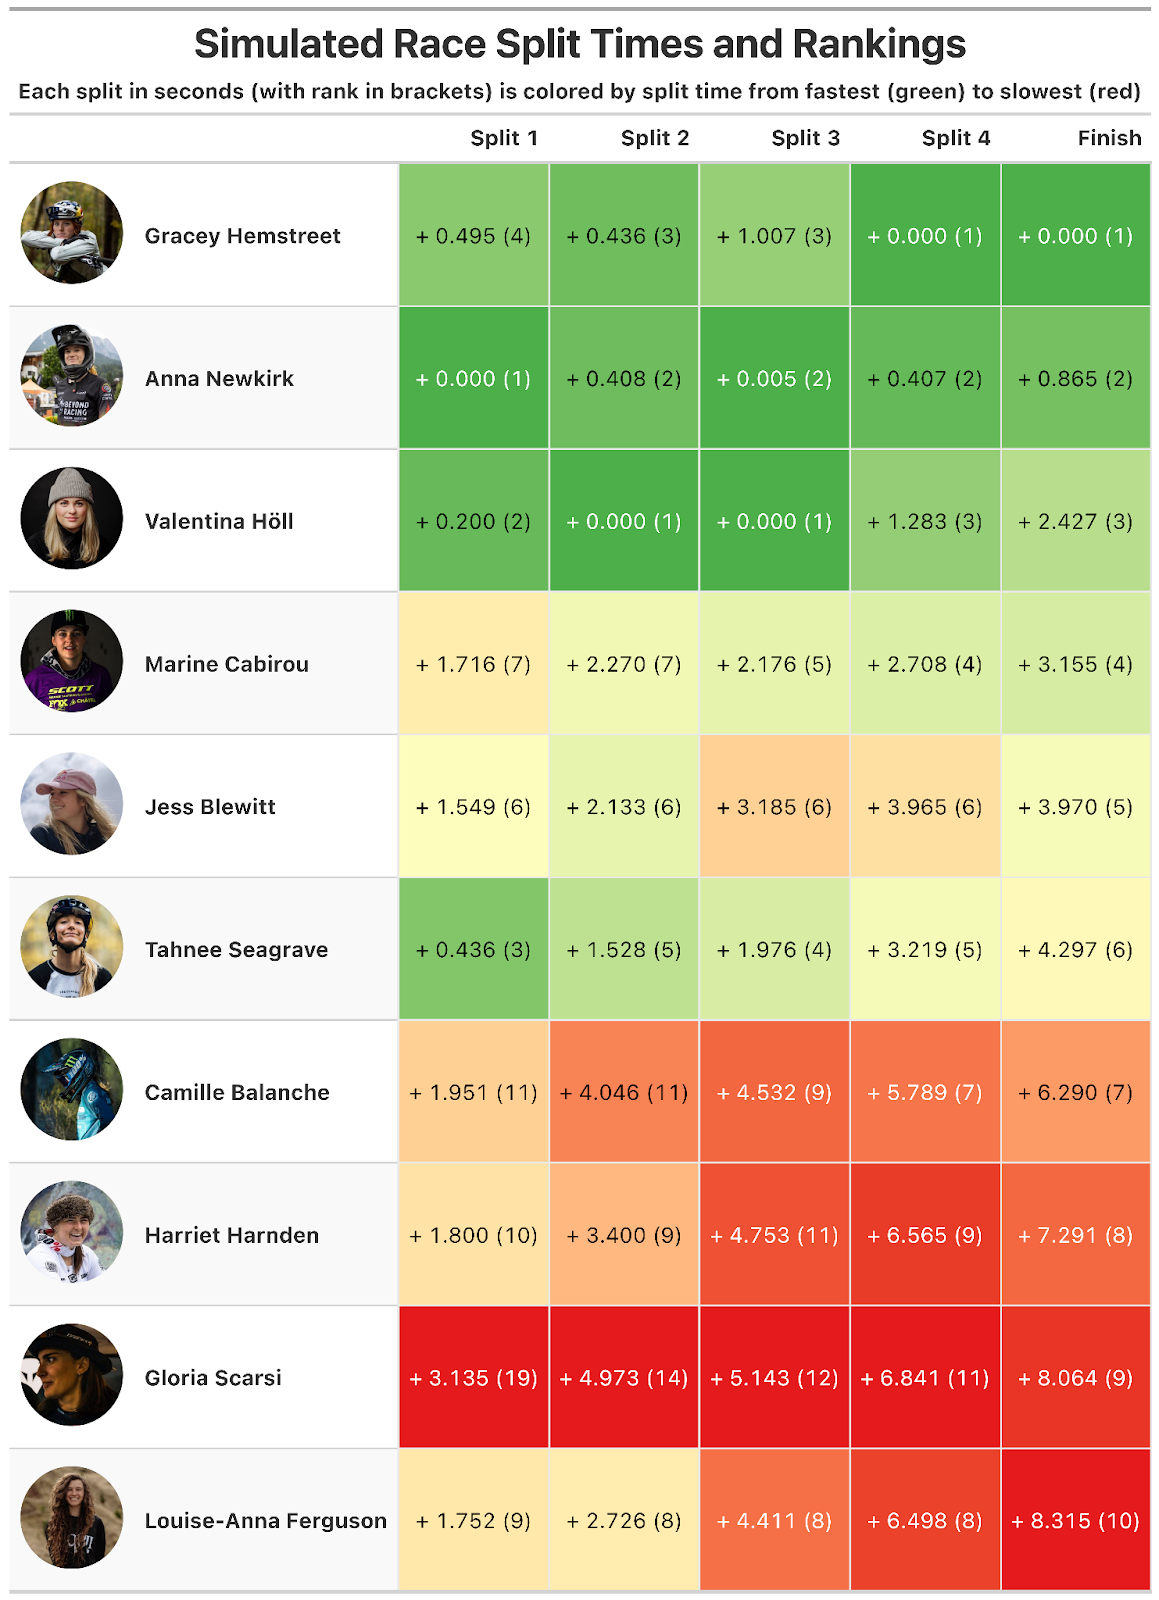
Let's break down the top 10 simulated race winners by split times to see what the hypothetical race would have looked like (spoiler alert: it’s almost a mirror image of the Finals):
The Ultimate Rider
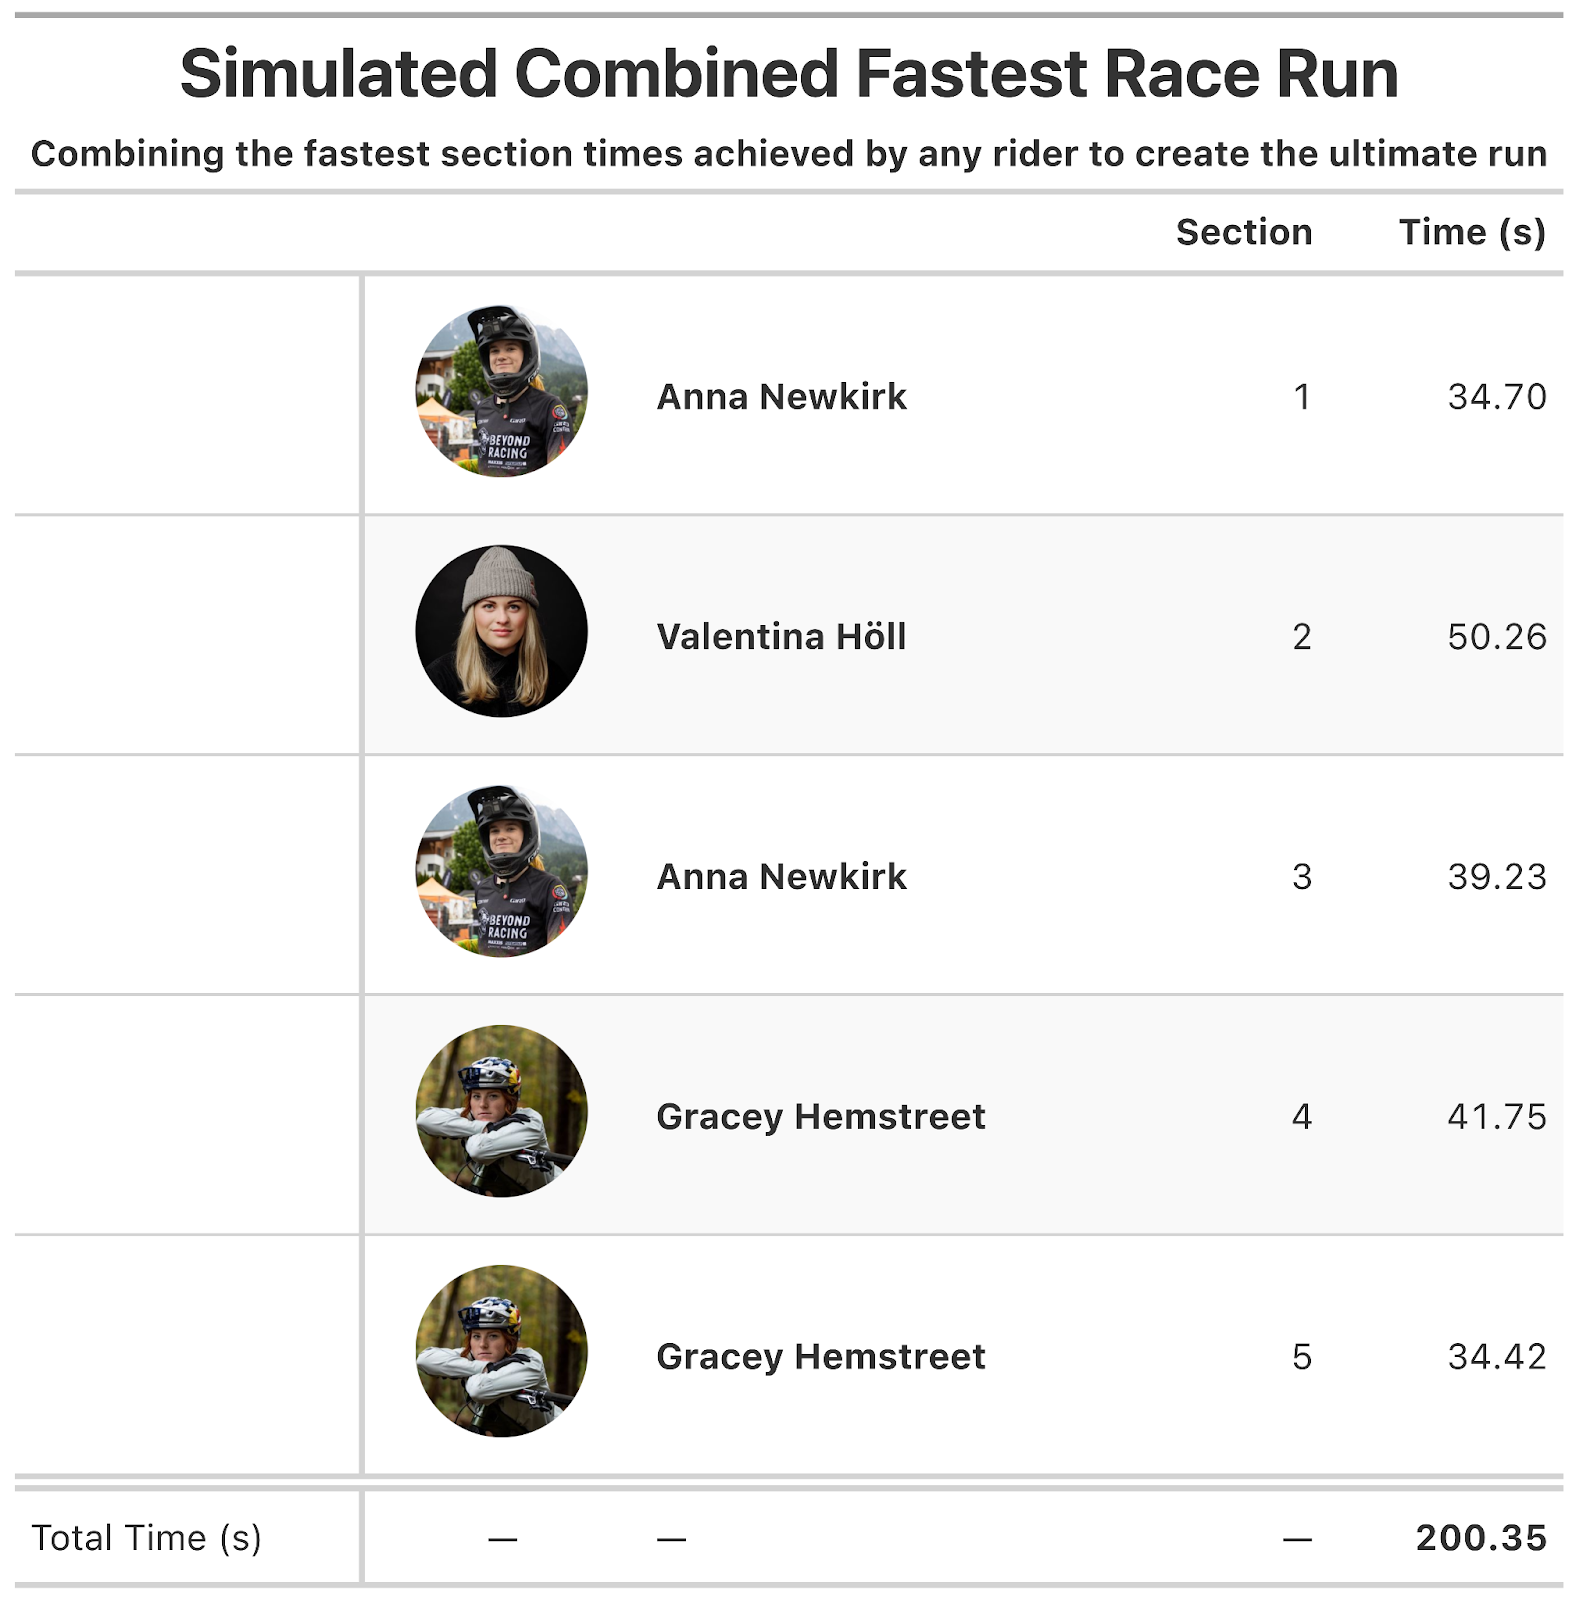
Beyond individual simulations, we can also conjure up the "ultimate downhill rider" by combining the fastest split times from all riders. For each section, we take the fastest time achieved by anyone and piece them together.
This ultimate simulated run clocks in at 200.35s (3:20.35). That’s over 1.5 seconds faster than Gracey Hemstreet’s winning time of 201.96s (3:21.96). This highlights just how much potential speed was still out there on the Leogang track, distributed among the various elite riders.
The Real Story: Section Four Was Key
While our simulated analysis offers a fascinating glimpse into what could have been, it’s crucial to examine how the race actually unfolded. By analysing the time each rider lost to the leader in each section during the finals, we can pinpoint where the race was truly won and lost.
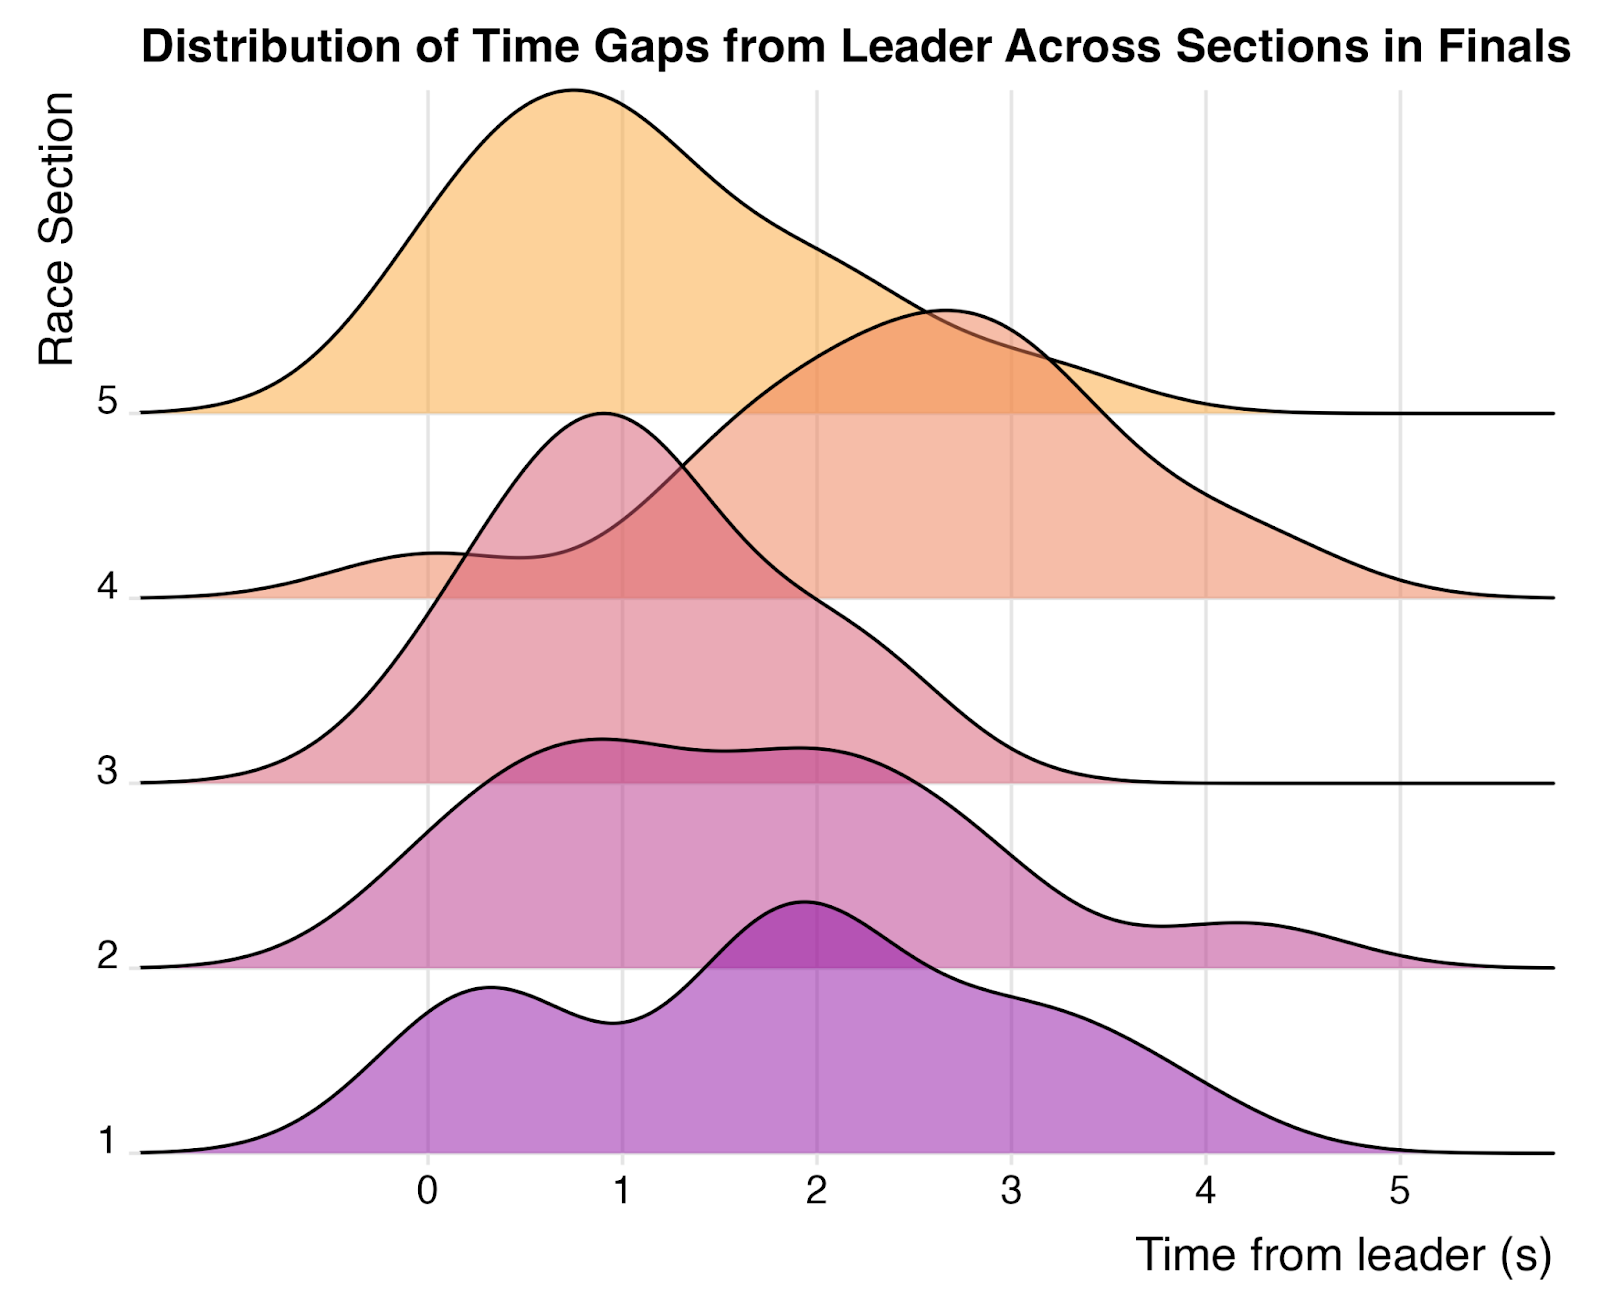
In this instance, there’s no mystery: the race was decided in section four. The long left tail on the distribution of section four in the above plot is caused by Gracey Hemstreet, where she bettered the next best competitor, Anna Newkirk, by a staggering 1.41 seconds by absolutely dominating the woods. Even in the simulated world, this 1.41 second gap between Gracey and Anna holds true, proving it wasn't just a Finals fluke. If you’re a competitor of Gracey's, you should be studying exactly what on earth she did in that section.
Speed Improvement Index
For each Elite Female rider we can calculate how quickly they ramped up their speed over the course of the race weekend. To do this let’s create a “Speed Improvement Index” where we:
- Calculate the difference between each rider's fastest Qualifying run (1 or 2) and fastest Timed Training run.
- Calculate the difference between each rider's Final run and fastest Qualifying run.
- Divide step 2 by step 1 to calculate a Speed Improvement Index.
By doing this we calculate the improvement between each stage of the weekend (Timed Training, Qualifying, and Finals) and then finally calculate the overall rate of change of improvement. A larger Speed Improvement Index score signifies a larger rate of change in speed over a weekend. A lower score, a lower rate of change in speed.
Calculating a Speed Improvement Index allows us to only compare relative performance between competitors, and not absolute performance. For instance, a rider could have a high index score (meaning the rate at which they built their speed over the weekend grew), but still have performed poorly as their overall Final time was still slow (even if it was much better than their initial Timed Training and Qualifying times).
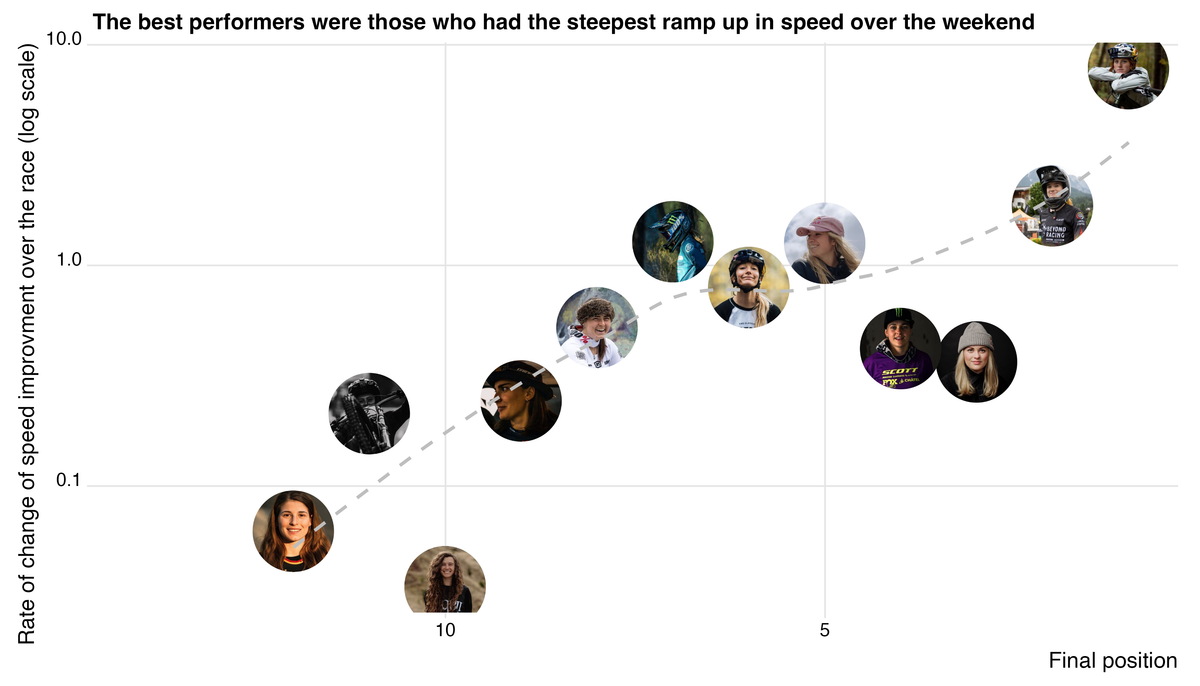
On one hand, you might think that riders with lower Speed Improvement Index scores would be the best performers, as a low score could signify that they quickly built and maintained their speed over a weekend, allowing them to perfect the minutiae of their runs. But, the opposite appears to be true! We can see this if we plot speed improvement index scores against Final ranking:
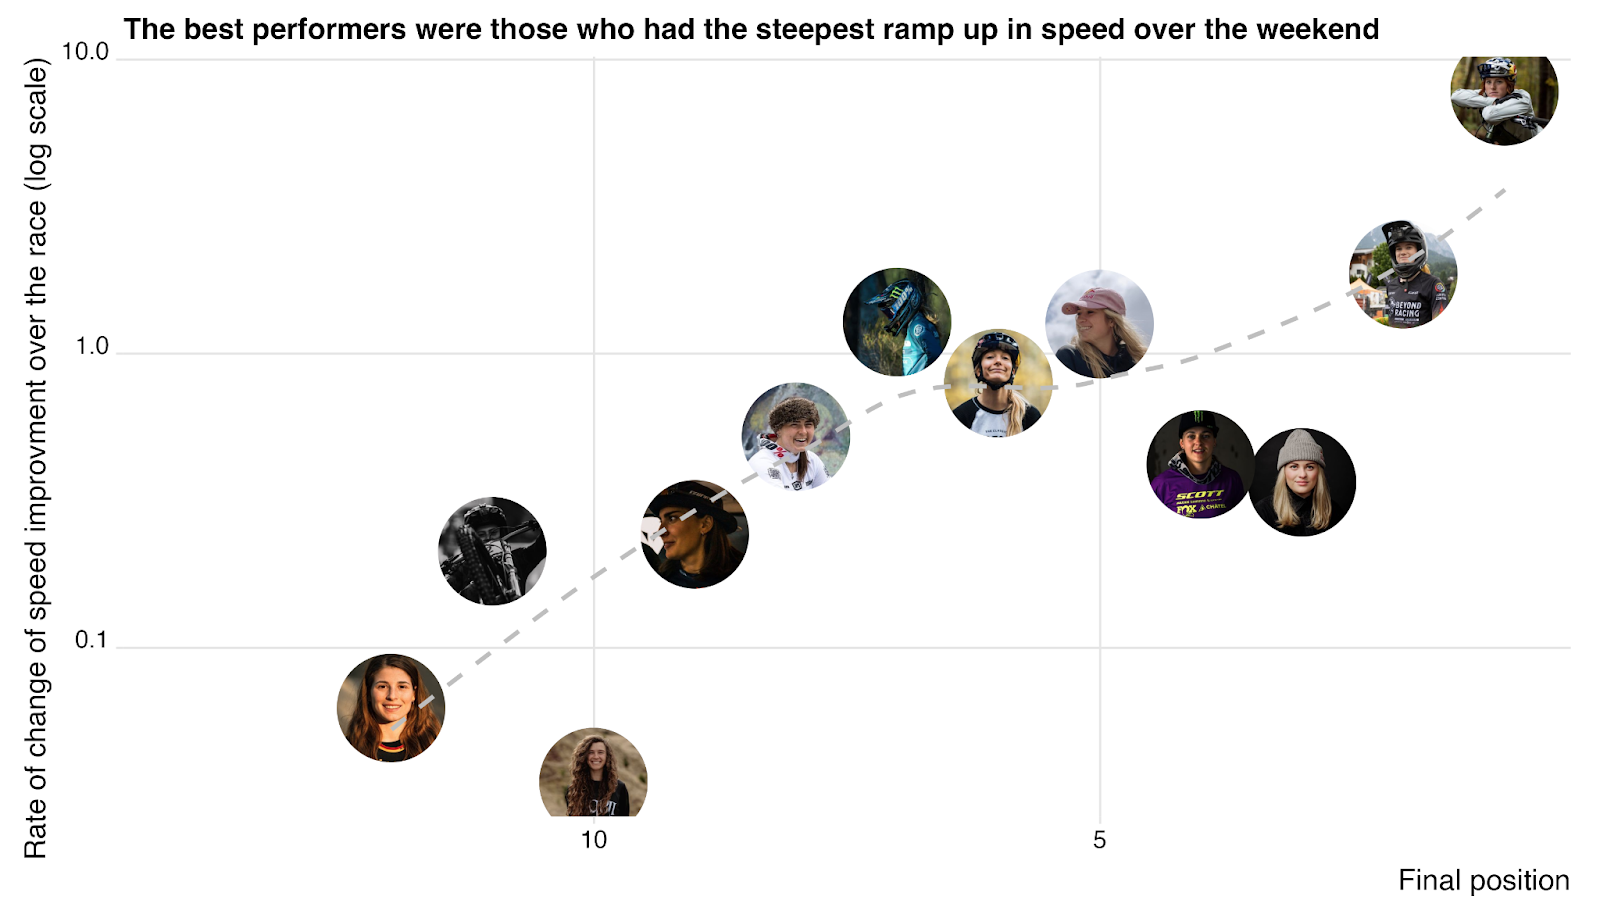
Here, we can see a semi (log) linear relationship between Speed Improvement Index scores and Final position ranking. This suggests that the ability to leave some gas in the tank and ramp up speed throughout the weekend is advantageous. While this feels somewhat intuitive and obvious, it’s worth noting that this goes contrary to what many of the Elite Men claimed in post-race interviews after both Loudenvielle and Leogang. A common theme among the men was that it’s as important as ever to quickly find your speed in Timed Training and maintain it, as you can’t afford to build it up.
So, what explains this trend? Is it a phenomenon that only holds true for the Elite Women? Was it specific to this race only? Or, is it just a happenstance correlation due to a few skewed data points? The answer is, we don’t know. But, in future races, let’s build out Speed Improvement Indices and try to answer some of these questions.
Looking Ahead to Val di Sole
Val di Sole is on the horizon, and we are here to help you strategize some good Vital Fantasy League picks:
- Young guns: Anna Newkirk is looking solid. She recorded the fastest times in section one and three at Leogang, and we wouldn’t be surprised if she manages to piece it all together one of these days to take the win.
- Seasoned elite: Tahnée Seagrave took the win last year in Val di Sole and is in good form this year, having already secured a win at the first round in Bielsko-Biała. You’d be foolish to count her out again this year.
- Redemption: Valentina Höll missed out on the win in her home race at Leogang and we wouldn’t be surprised if she comes to Val di Sole hunting for redemption.
Just a quick thanks for all the feedback so far – keep it coming! We’ll do our best to embed it in future analyses in this series.
All the data and code used in this analysis can be found in the open-source downhillr R package here.